How to measure engineering
From Leadership in Tech · subscribed via aiste.ulozaite@gmail.com · original ↗ · unsubscribe
- ValueSum metric tracks value delivered over time by scoring shipped items
- Works across product, engineering, and design teams
- Enables learning by rescoring features months later to validate predictions
Yes you can measure engineering
August 2, 2026by Jade Rubick
I’d like to share my favorite way of measuring the value delivery of engineering organizations. It’s something I’ve used at a lot of companies. I call it the ValueSum metric.

Why the ValueSum metric?
I like this metric because it has a number of advantages over anything else I’ve seen:
- It is a cross-functional measurement, meaning it measures engineering, product, and design. The measurement incorporates how each of the functions are working separately, but also shows how well you’re working together.
- It’s less easily gamed than most other metrics. And many of the ways you might game it aren’t harmful.
- It proxies the value of the work delivered more than anything else I’ve seen.
- It can be applied retroactively, so you can compare changes you make in the future with things that happened before you even started making the measurement.
- It has some nice hooks for retrospectives and learning, so you can improve as a team.
- Yes, you can measure if AI is increasing the value delivery of engineering! You’re measuring the whole value delivery.
What is the ValueSum metric?
The basic idea of the ValueSum metric is that you add up everything that you deliver, and each item is multiplied by how valuable the work was.
The bigger the score, the better.
Let’s say you have three items that you deliver in a one-month period. You score each item using a rubric and you end up with a table that looks like this:
Deliverable
Score
New pricing tool
6
Automatic invoice generation
8
Foreign currency support
3
ValueSum for time period
17
Why is that score useful?
There are a couple of things to know about these scores:
- The faster you deliver things, the more things you deliver. And then the higher score you have.
- The more valuable the work you deliver, the higher score you have.
- So essentially this is a metric that captures value delivered over time.
At its heart, a lot of product management approaches prioritize based on value over time. This just extends that same concept to how you measure afterwards.
How to implement ValueSum
It’s straightforward to implement the ValueSum metric:
- Create a scoring system and a tracking spreadsheet.
- In that spreadsheet, create a list of all the things that have been delivered recently. I usually will go back to the beginning of the year or the previous year.
- Have a product leader score each item, based on a rubric. This gets you a baseline.
- Have an engineering leader or tool add how long each item took to deliver. (This isn’t strictly necessary, but can help identify items that were most valuable per unit time).
- Put in place some sort of process to ensure you add new items to the list and score new items periodically or continually.
- Talk about the metric in meetings. Put it on your dashboards.
That gives you the basics. Once you have the basics in place, you have a lot of sneaky leverage.
Sneaky leverage 1: can compute ahead of time
Is ValueSum a leading or lagging metric? Technically it’s a lagging metric, but you can also use it as a leading metric.
- If you have a good work culture, an organization that understands ValueSum will want to increase that number over time. We want to get better at the delivery of value, right?
- A thing to introduce is the idea of scoring the value of the items before they are delivered. (Product might already be doing this).
- And you can loosely estimate the effort ahead of time.
- But most importantly, you can have discussions about how to improve the score: can we make it more valuable? Can we make it take less time, or be delivered more incrementally?
- Involve the team in these discussions, make them a natural part of the team’s vocabulary.
- Profit.
Sneaky leverage 2: can retrospect and learn
Your scoring system is going to be imperfect. People never estimate the value very well. Or even score very well. So…
- Three months or six months after each feature is delivered, have people rescore the features based on the value you’re now seeing.
- Your perspective will be different, and it will probably be sobering.
- But it will also help people score better in the future.
- This can help the organization develop the discipline to ship software people actually value.
- You might keep both values around, so you can see ValueSum and RetroValueSum together. That will give you an idea of the spread between what you predicted and what you evaluated retroactively. Over time you probably want to see that spread go down (but don’t optimize for it).
Sneaky leverage 3: can validate early
Product development organizations are often pretty bad at validating (or invalidating) ideas.
- They can be either too slow, or too ineffective at validation.
- ValueSum incentivizes validating ideas early. Why? You don’t want to invest a lot in something that isn’t valuable.
- So, create small projects to prove or disprove something will be valuable, rather than investing a ton of time in building it. Even in the age of AI, it’s important to build the right things. It’s probably more important than ever to build the right things.
Sneaky leverage 4: you tie engineering, product, and design together
- If engineering is slow, less ValueSum points are delivered.
- If product isn’t prioritizing valuable work, less ValueSum points are delivered.
- If the work isn’t well designed, or is low quality, or not reliable, it won’t be as valuable.
- Dysfunction like departments not working well together show up in the ValueSum metric. Improving things should be represented as well.
Sneaky leverage 5: you’re incentivizing incremental delivery
- There are numerous advantages to delivering incrementally.
- ValueSum will tend to reflect that. Delivering a project as three smaller projects will tend to get a higher ValueSum score than one larger project.
Devil is in the value scoring
The most subjective part of this metric is the value scoring. Don’t get too caught up in the fact that it is subjective. This is, after all, an imperfect metric, just like every metric is imperfect. And the fact that it is imperfect is something that you can learn from.
I would usually choose somebody that represents the customers to be the scorer. Often it should be the head of product. It could be the CEO.
I can’t emphasize enough that you need to have your product leader on board for the scoring. They need to see this as a critical job responsibility and a real lever for understanding the value the organization is delivering. If you’re not the product leader, you should codevelop the scoring system with them.
I’ve done the value scoring a lot of ways, and some of them have gone better than others. One thing to be very sensitive to is that the people doing the scoring need to be really bought into the approach. At one company, I was very interested in using real economic modeling for features. I found that the product leaders that were responsible for scoring weren’t interested in spending that much time on evaluating the economic model or estimates for how features would perform.
There are companies that have done economic modeling for their features, and that’s what Donald Reinertsen of the Principles of Product Development Flow recommends. There is a lot to be said for that approach, but it also is a little more rigorous than I think most environments are willing to tolerate, and it does have some overhead.
One simplification I once experimented with was orders of magnitude of financial value. This tied the features to the actual expected financial value, but it was only about the order of magnitude, not the exact value. I have a variation on that approach below as a sample scoring system.
There is nothing wrong with starting with a very simple system. The example spreadsheet I share later has a letter grade for the value of each feature. That worked fine!
I do think it’s important for a really well-developed scoring system to have some proportionality of the scoring system. So for example, if you’re using numbers, you might have a value of 5. A value of 10 should be approximately twice as valuable.
A really good place to start is to look at the way that product is prioritizing work. Many prioritization frameworks are conceptually pretty close to ValueSum, and it may not require much additional work. And some product management software actually has the concept of formulas for this type of thing. So product managers may already be scoring things in a way that is very easy to translate.
It’s not terribly difficult to change your scoring system later, so this is not a one-way door. The most important thing is to come up with something that’s pretty good and get started using it.
An example scoring system (simple)
At one company I was at, we used a simple letter grade for the value measurement. The product manager used an A, B, C, D, F for value delivered. And then a spreadsheet translated the value of each letter to twice the value of the letter below it.
This was a pretty arbitrary system, but it was quick and easy. We used it in a pretty small startup, and it was fine for our needs at the time.
An example scoring system (more advanced)
Here is a scoring system that is a little more rigorous. It may be more than a lot of startups want to do, but it’s also close to the financial modeling approach.
- A score of 100 is equivalent to adding that much percentage ARR to the company. Or saving that much ARR percentage.
- A score of 50 is half of that.
- We use a one year time horizon.
- So for a company that has a $10 million ARR, a feature with a score of 50 would make or save $5 million ARR.
- All scores are multiplied by the expected probability of success.
So how do we score an architectural project that improves the reliability of our software for a particular class of issues that is causing lots of instability? We use back-of-the-napkin math:
- We estimate that a third of our current customers are at risk of churn due to the class of instability that this work addresses. Naively that would be a score of 33, because it’s a third of our revenue.
- But, we estimate that they are weighted towards our larger customers, so we’d lose a lot more than just a third of our customers. Maybe 45? Representing 45% of revenue.
- However, the actual risk of losing customers is probably 20% per customer. Score drops to 9.
- There’s also some reputational damage and crossover between these stability issues and other stability challenges. Let’s say you think that is worth about as much as the work itself. That would double the value to 18.
- So we score it at 18.
It’s okay if we score it wrong. In three or six months, we can reevaluate. Of course, there is a bias against recognizing the value of this type of work in the future, because if successful, those problems will be invisible. But we can look at the churn rates and discuss it, and see if we think it was as valuable as we thought.
One thing that is nice about this approach is that it is scaled with the size of the company, so it doesn’t get artificially inflated every year. Many economic models will make it look like you’re getting 20% better every year if your company is growing 20%. This avoids that.
If your team has the discipline for it, you can gradually develop a set of guidelines and heuristics. One thing you can do is also keep track of the thinking behind each score.
Example spreadsheet
I put together a very simple example of using ValueSum in a spreadsheet. It uses one of the simplest assessments possible (a letter grade) for each feature, and a days/weeks/months selector for how long it took to complete. This is probably simpler than what you want, but this is totally fine to start with.
On the lookups page, you can see that I made each letter grade twice as valuable as the one above it. So a value of A was twice as valuable as B, and four times more valuable than C. This was arbitrary, but you need to decide what the scales look like.
You can get nice charts showing how your value delivery is improving over time.

Goodhart’s Law
Y’all know about Goodhart’s Law, right?
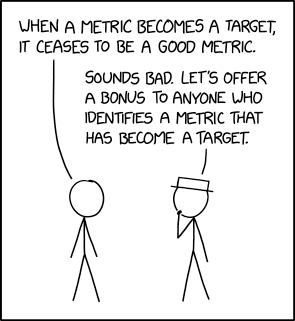
Almost any metric that you use for evaluating people will be gamed in a way that is harmful. I don’t recommend using ValueSum to measure individuals or teams for bonuses or promotions.
It’s more useful as an indicator of how value delivery is doing over time. So the best person to evaluate with this metric is the leaders of product development. But even then, I wouldn’t tie it to salary or bonuses.
If you absolutely have to do some sort of bonus system for the leadership, I do think ValueSum is probably (a little) less harmful than a lot of the alternatives. But Goodhart’s Law rules, and don’t forget that.
An example of this is that a certain percentage of every engineering organization should be focused on things that make the organization more efficient over time. For example, doing simplification projects or migration projects. This type of work will typically get shortchanged if you optimize purely for ValueSum, because the time horizon might be further out.
When you might not want to use ValueSum
- Any environment where Goodhart’s Law is going to come into play is a contraindication.
- The grader is often the person who is being scored, so there can be a temptation to inflate value over time.
- If you don’t actually have much agreement that you want to measure the value delivered.
Using ValueSum to measure AI impact
Many of the engineering leaders I’m talking with nowadays are frustrated by the fact that they’re seeing local productivity improvements with very high multiples. For example, this seems to speed up coding by 10x! Yet the impact on overall productivity and value delivery is not shown as directly.
I used ValueSum at a company in 2025, and we were able to see overall value delivery improvements. AI played a part in that, but there were also a lot of other things we were doing to improve value delivery. Although ValueSum doesn’t give you attribution, it does show the real impact and accounts for the other bottlenecks in your system.
A few tips and experiences
I’ve used ValueSum at a couple of companies. Here are a few things I’ve learned:
- As I mentioned, you have to have full buy in across product development leadership. The first time I tried something like ValueSum, it largely failed because I had a couple of product counterparts who weren’t bought into the idea of economic modeling. I was really into what seemed too complicated for them. I also think they felt I was also telling them how to do their jobs. This was my own change management failure, but keep in mind for this to work you need to get that part right.
- At a company in 2024, I mixed in ValueSum with a prioritization framework at the same time. That went fine, but in retrospect I would have implemented ValueSum in a lightweight way, without changing the prioritization framework or changing our workflows. It’s easier to get ValueSum going, and then make all the prioritization framework changes after the fact. ValueSum can also lay the groundwork for the prioritization framework if you line it up carefully.
- At a company in 2025, it went quite well. We used it to provide visibility into the improvements we were making in engineering and product, and it was successful in getting the CEO and board to understand the impact of the changes we were making. Product and engineering leaders were both willing to do the work, and we reaped the benefits.
- Candidly, I have not integrated design super well into this in the past. Let me know your experiences with that.
- Anything you don’t score is invisible. This can mean that when you go back and do things retroactively, you miss things. Or, if you aren’t diligent about going forward and tracking things, you’ll undercount going forward.
- The time horizon for your analyses have to be big enough that it makes sense. For example, if you’re delivering one or two things a week, reporting on the score every week may not make sense.
- I generally score based on the customer or the business impact. Sometimes engineering will want to include projects that are purely technical. Unless there is a way to translate that value to customers, I generally would not consider those to be value delivered.
Do you do it by team or by organization?
I’ve generally done it by organization. I have done it for second SKUs. And it would work fine for teams, but just keep in mind the scores are not relevant between teams, unless you have a scoring system where that makes sense. And if you are comparing teams to each other, I question whether you’re infringing on Goodhart’s Law.
Isn’t this like measuring velocity in Scrum?
It’s very common in Scrum to use story points as a measure of “velocity”. How is this different?
“Velocity” measures how complicated you thought the work was. It’s a sum of your estimates, that you’ve completed.
There’s a fair amount of evidence that story points are not an effective way to measure the output of teams. The originator of story points disavowed them. A number of people have found that you get the same results by counting the number of things delivered (see Story Points Considered Harmful, Are story points useful?).
ValueSum is a little bit different because you’re adding up the value you think you delivered, and how long it actually took to do it is an automatic factor. You can retrospect on the value you delivered later, and learn from it. So it’s a very different approach.
Is this like COD or CD3 or WSJF?
Yes, in many ways this is similar to the COD (Cost of Delay), CD3 (Cost of Delay Divided By Duration), or WSJF (Weighted Shortest Job First). Those are prioritization frameworks, but if you’re using any of them, you could just use the same idea and extend it to how you measure the organization afterwards. Just use them as the scoring system. \
In practice, I find it much easier to explain and reason about ValueSum, because you don’t actually have to think about the duration, you just are adding up the value of everything you’ve done in a time period. You need a primer to understand what COD, CD3, or WSJF are – ValueSum is pretty simple conceptually.
Let me know how it goes for you
As you experiment with ValueSum, let me know how it goes. I like to hear experience reports, and might update this if you provide feedback!
Thank you
Donald Reinertsen’s Principles of Product Development flow was quite influential on me. As was the Merck Farming Black Swans article. I reviewed both on those links.
Cover photo by Margaret Neuhaus: https://www.pexels.com/photo/number-of-bingo-chips-6802741/
Please enable Javascript to view comments.
| // Load Talkyard script once (similar to React componentDidMount) (function() { if (window.talkyardScriptAdded) return; var scriptElem = document.createElement(‘script’); var headOrBodyElem = document.getElementsByTagName(‘head’)[0] | document.getElementsByTagName(‘body’)[0]; scriptElem.async = true; scriptElem.type = ‘text/javascript’; scriptElem.src = window.talkyardScriptUrl | ‘https://c1.ty-cdn.net/-/talkyard-comments.min.js’; headOrBodyElem.appendChild(scriptElem); window.talkyardScriptAdded = true; })(); |